From 5% Canary to 50% A/B to 100% Rollout
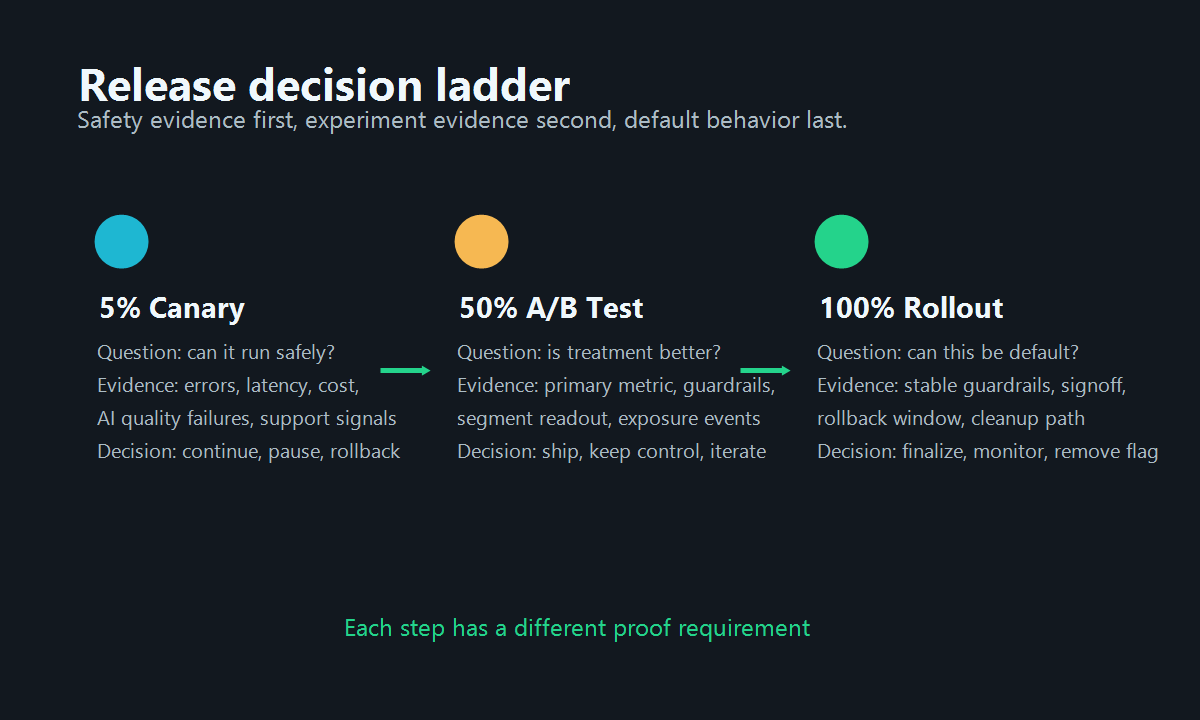
A 5% canary, 50% A/B test, and 100% rollout should be treated as three different release decisions, not one gradually expanding switch. The 5% canary asks whether the change is safe enough to keep in production. The 50% A/B test asks whether the new behavior is better enough to justify broad adoption. The 100% rollout asks whether the team can make the winning behavior permanent, keep a rollback path for a defined window, and clean up the temporary flag.
That distinction is especially important for AI changes. A prompt, model route, retrieval rule, recommendation algorithm, or agent workflow can pass automated tests and still fail in production because quality, latency, cost, or user trust changes under real traffic. A staged rollout lets the team expose risk deliberately, learn from measurable evidence, and stop expansion before a small problem becomes the default experience.
The Reader Job Behind This Rollout Sequence
The search query is not asking for a generic definition of canary release or A/B testing. The practical reader job is: "How do I move a risky change from tiny production exposure to experiment evidence to full release without guessing at each step?"
The useful answer is a release-decision ladder:
| Stage | Primary question | Typical exposure | Main evidence | Decision |
|---|---|---|---|---|
| Canary | Is this safe enough to keep running? | 5% or a narrow target cohort | errors, latency, cost, support signals, obvious quality failures | continue, pause, or roll back |
| A/B test | Is the new behavior better than control? | 50% control and 50% treatment | success metric, guardrails, exposure events, segment readout | ship treatment, keep control, or iterate |
| Full rollout | Can this become the default? | 100% treatment | stable guardrails, product signoff, rollback readiness, cleanup plan | finalize, monitor, and remove temporary code |
FeatBit's progressive rollout patterns page covers the broader family of rollout strategies. This article narrows the task to one operating sequence: canary first, experiment second, full release last.
Stage 1: Use 5% Canary For Production Safety
The 5% canary is not the experiment. It is the production safety check before the real experiment begins.
At this stage, do not optimize for a statistically clean business readout. Five percent of traffic is often too small and too short-lived for that job. Instead, use the canary to answer operational questions:
- Does the new AI behavior execute in production without elevated error rates?
- Does latency stay within the user-facing service budget?
- Does cost per request stay within the expected range?
- Are fallback paths working when the model, prompt, or downstream service fails?
- Are support tickets, manual corrections, or user complaints appearing in the canary cohort?
- Is the event instrumentation recording exposure and outcome data correctly?
For a conventional product feature, the canary may focus on errors, performance, and support signals. For an AI change, add quality and cost guardrails. A model may be technically available but produce worse answers, overuse expensive tools, or route more cases to human review. Those are release risks even if uptime looks normal.
Define the canary gate before traffic starts:
canary_gate:
  exposure: 5_percent
  minimum_window: 24_hours
  advance_when:
    - no critical incidents in treatment cohort
    - p95 latency within agreed service budget
    - error rate not materially worse than control
    - AI quality review has no severity-one failures
    - cost per successful task within budget
    - exposure and metric events are visible
  rollback_when:
    - safety or correctness issue appears
    - guardrail threshold is breached
    - telemetry is missing or inconsistent
If telemetry is missing, do not advance. A silent canary is not evidence. It is only unmeasured exposure.
Stage 2: Move To 50% A/B Testing For Decision Evidence
Once the canary is clean, the release question changes. The team no longer asks, "Can this run?" It asks, "Is this better than the current behavior?"
That is why 50% A/B testing belongs after the canary. A balanced split gives the team a live control group and treatment group under similar production conditions. For AI systems, that comparison may involve:
- prompt version A versus prompt version B;
- current model route versus a new model route;
- old retrieval strategy versus a new retrieval strategy;
- human-review-first workflow versus AI-draft-first workflow;
- deterministic recommendation logic versus AI-ranked recommendations.
The 50% split should include both a primary success metric and guardrails. The primary metric might be task completion, conversion, accepted answer rate, support deflection, or time to resolution. Guardrails might include latency, error rate, cost per request, manual correction rate, complaint rate, and downstream business impact.
Use FeatBit's measurement design guidance to separate the metric that decides the experiment from the metrics that stop the rollout. This prevents a common failure mode: the treatment improves a visible business metric while quietly damaging reliability, support load, or user trust.
For a 50% A/B test, write the decision rule in plain language:
experiment_decision:
  exposure: 50_percent_control_50_percent_treatment
  primary_metric: successful_task_completion
  guardrails:
    - p95_latency
    - cost_per_successful_task
    - human_correction_rate
    - support_contact_rate
  ship_treatment_when:
    - treatment improves primary metric enough to matter
    - no guardrail crosses the rollback threshold
    - segment readout does not show unacceptable harm
  keep_control_when:
    - treatment does not improve the primary metric
    - guardrail impact is worse than the benefit
    - evidence is inconclusive after the planned window
For teams using Bayesian interpretation, FeatBit's Bayesian A/B testing for builders page gives a practical frame for turning experiment readouts into a release decision without turning the rollout meeting into a statistics ritual.
Stage 3: Roll Out To 100% Only After The Decision Is Made
A 100% rollout is not "the experiment got bigger." It means the experiment decision has been made and the treatment is becoming the default experience.
Before switching every eligible user to the winning behavior, check four things:
- The winning variation is clear enough to explain in a release note or decision record.
- Guardrails remained acceptable during the experiment window.
- Rollback remains possible for a defined period after full exposure.
- The temporary experiment or rollout flag has a cleanup path.
The cleanup point matters. If the treatment is now the default, the flag should not remain as a vague permanent branch. Keep a separate operational kill switch only if the team still needs runtime rollback after the release decision. Otherwise, record the final behavior, update tests, and remove temporary flag logic after the rollback window.
FeatBit's feature flag lifecycle management model is useful here because it treats a flag as a release asset with type, owner, evidence, decision, and cleanup path. A rollout is not complete when 100% of users see the treatment. It is complete when the decision is recorded and the temporary control is either removed or intentionally converted into a permanent operational control.
A Practical FeatBit Operating Model
FeatBit is useful for this sequence because the same feature flag can carry targeting, percentage rollout, variation assignment, audit history, and experiment context through the whole release decision.
A practical operating model looks like this:
| Operating need | FeatBit role |
|---|---|
| Start with internal users or a narrow 5% cohort | Use targeting rules and percentage rollouts |
| Keep users consistently assigned to a variation | Evaluate the same flag with stable user context |
| Compare control and treatment at 50% | Use variations and experiment tracking |
| Connect outcomes to exposure | Send evaluation and custom metric events |
| Pause or roll back expansion | Change the flag rule without redeploying code |
| Explain who changed the rollout | Use audit history and release notes |
| Avoid stale rollout branches | Apply lifecycle ownership and cleanup expectations |
The implementation detail is still important: evaluate the flag at the right boundary, pass the evaluated value into the code path, and keep fallback behavior explicit. If AI assistants help draft flag plans or cleanup changes, use the workflow in AI-assisted flag management so the assistant drafts the plan while FeatBit remains the release-control system.
What To Measure At Each Stage
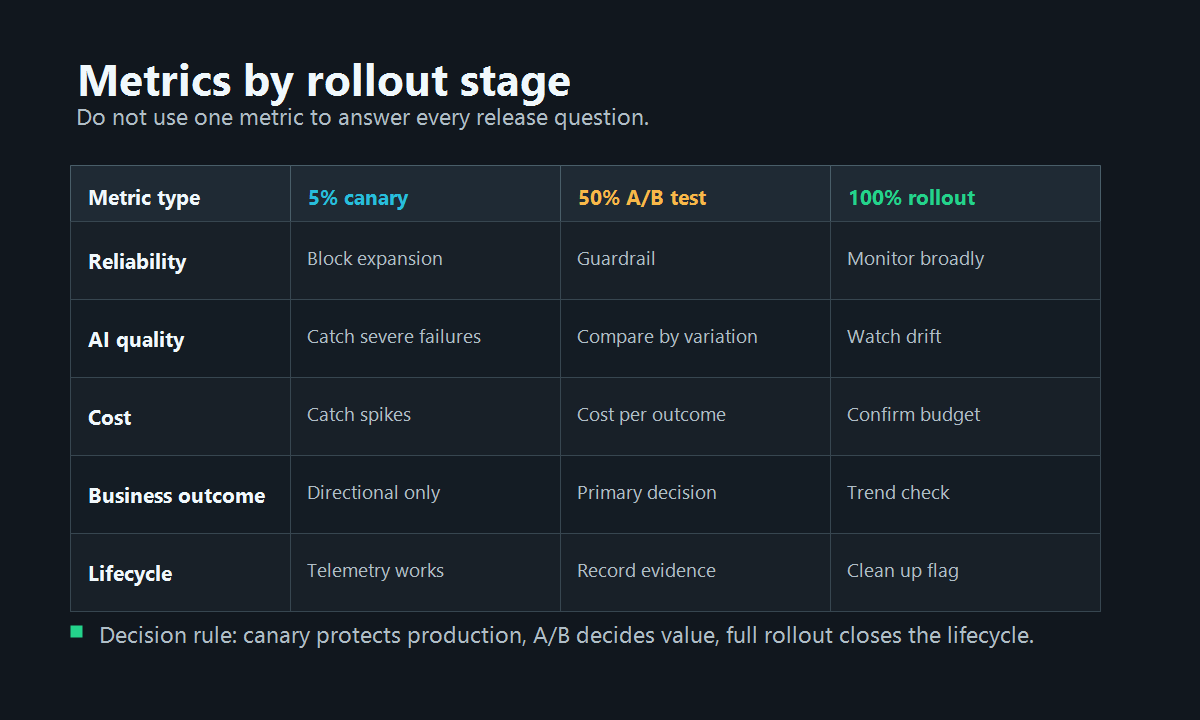
The same metric set should not drive every stage. Canary, A/B test, and full rollout need different evidence.
| Metric type | 5% canary | 50% A/B test | 100% rollout |
|---|---|---|---|
| Reliability | Block expansion on error or latency regression | Guardrail against hidden harm | Monitor for broad regression |
| AI quality | Review severe failures and corrections | Compare quality rate by variation | Watch drift and complaints |
| Cost | Catch request-level cost spikes | Compare cost per successful outcome | Confirm budget impact at scale |
| Business outcome | Usually directional only | Primary decision metric | Confirm expected post-release trend |
| Support signal | Watch early complaints | Compare support contact rate | Monitor volume after default switch |
| Lifecycle | Confirm telemetry works | Record decision evidence | Remove or convert temporary flag |
This is the core distinction: the canary protects production, the A/B test decides whether the change is worth shipping, and the 100% rollout operationalizes the decision.
Common Mistakes In This Sequence
Treating 5% canary as proof of business value. A small canary can catch production faults, but it should not be asked to prove the product hypothesis unless the traffic volume and experiment design support that conclusion.
Skipping the control group at 50%. If every user gradually receives treatment and there is no comparable control group, the team may confuse seasonality, traffic mix, or marketing changes with product impact.
Changing metrics after the A/B test starts. If the primary metric changes midstream, the readout becomes easier to rationalize and harder to trust. Add diagnostic metrics if needed, but keep the decision metric stable.
Rolling out to 100% without a rollback window. Full rollout should not remove every escape path instantly. Keep rollback available long enough to detect delayed effects, then clean up deliberately.
Leaving experiment flags forever. A completed experiment flag that remains in code becomes stale release logic. Convert it to a documented operational control only when there is a real ongoing runtime decision.
Example Rollout Runbook
Use this runbook as a starting point for an AI feature such as a new support-answer prompt or agent workflow.
| Step | Owner | Gate |
|---|---|---|
| Define flag purpose, owner, variations, fallback, and cleanup date | Engineering lead | Flag intent reviewed before implementation |
| Instrument exposure and outcome events | Product engineer | Events visible in test environment |
| Enable for internal users | Product and support | No blocking qualitative issues |
| Expand to 5% canary | Engineering on call | Reliability, quality, cost, and support guardrails clean |
| Start 50% A/B test | Product owner | Primary metric and guardrails pre-committed |
| Decide winner | Product and engineering | Experiment evidence supports treatment or control |
| Roll treatment to 100% | Release owner | Rollback path remains available |
| Close release decision | Flag owner | Decision note and cleanup ticket created |
| Remove temporary flag path | Engineering | Tests updated and flag archived or converted |
For AI release work, this runbook also connects to FeatBit's safe AI deployment guidance: release risky behavior through internal targeting, canary exposure, metric gates, full release, or rollback rather than making one all-or-nothing production switch.
Source Notes
- FeatBit implementation context: targeted progressive delivery, percentage rollouts, experimentation, Track Insights API, flag insights, and feature flag lifecycle management.
- External category context: Flagsmith describes A/B and multivariate testing as using feature flags to compare variations and measure user behavior in its A/B and multivariate testing guide. This article uses that vendor example only as category context, not as a product comparison.
- Internal reader journey: continue with progressive rollout patterns, measurement design, Bayesian A/B testing for builders, and AI-assisted flag management.
Image And Open Graph Notes
- Use
cover.pngas the Open Graph image because it summarizes the three-stage rollout path. - Use
stage-gates.pngnear the opening explanation because it reinforces the three distinct release decisions already explained in crawlable text. - Use
metrics-matrix.pngin the 50% A/B test section because it helps readers separate primary metrics from guardrails without hiding the main guidance in the image.