How to Monitor Whether a Model Upgrade Gets Slower or More Expensive
Monitor a model upgrade by comparing the candidate route against the current route in production, using the same assignment key, the same time window, and the same product workload. The minimum evidence is not only "model B is live." You need to know which users or workflows received the candidate, whether the candidate actually ran, how long it took, how many tokens or billable units it used, what it cost per useful outcome, and which rollback action is available if the guardrails fail.
FeatBit's angle is simple: a model upgrade should be a reversible release decision, not an invisible configuration change. Use a feature flag to control who receives the new model route. Use telemetry to attach latency and cost signals to the resolved variation. Use guardrails to decide whether the rollout can expand, pause, or roll back.
Start with the release question
The operational question is not "is the new model better?" That belongs to evaluation and experimentation. The monitoring question is narrower:
When production traffic uses the upgraded model route, does it become slower or more expensive than the current route for the same kind of work?
That question needs a baseline and a candidate cohort.
| Monitoring need | What to compare | Why it matters |
|---|---|---|
| Latency | p50, p95, p99, time to first token, time to complete | A better answer can still miss the product's response-time budget. |
| Cost | input tokens, output tokens, tool calls, retrieval cost, provider cost | A model can improve quality while making each useful task too expensive to scale. |
| Reliability | timeout rate, retry rate, fallback rate, provider errors | Cost and latency often rise when retries and fallbacks hide failures. |
| Outcome-normalized cost | cost per resolved case, accepted answer, completed workflow, or successful task | Request-level cost can look acceptable while business-level economics get worse. |
| Segment impact | account tier, region, locale, workflow, prompt family, traffic source | Model upgrades often regress only for a subset of the workload. |
This is distinct from a full AI model A/B test for business impact. An A/B test asks whether the candidate improves the product outcome. This monitoring playbook asks whether the candidate stays inside latency and cost guardrails while that decision is being made.
Put the model route behind a flag
If the model upgrade is only a deployment variable, observability has to infer who saw what. That is fragile. The model route should be a named runtime decision with a stable flag key, explicit variations, targeting rules, and a fallback.
flag:
  key: support_answer_model_route
  type: json
  variations:
    control:
      modelRoute: support_current
      promptVersion: support_v3
      maxOutputTokens: 700
    candidate:
      modelRoute: support_upgrade
      promptVersion: support_v3
      maxOutputTokens: 700
    fallback:
      modelRoute: support_current
      promptVersion: support_v3
      maxOutputTokens: 500
targeting:
  first_scope: internal_users
  canary_scope: 5_percent_of_eligible_support_conversations
rollback:
  defaultVariation: fallback
The flag value should select a named route, not store secrets or large prompts. Keep provider credentials, prompt assembly, retry policy, and safety handling in the application or model gateway. The flag decides which approved route is exposed.
FeatBit's AI control layer and safe AI deployment pages cover the broader pattern: control exposure, observe production behavior, and roll back without redeploying. For implementation primitives, FeatBit docs cover targeting rules, percentage rollouts, and feature flag insights.
Emit one telemetry contract for every model call
The monitoring contract is the event or span shape that lets teams join feature flag exposure, model execution, cost, latency, and outcome. Write it before the candidate reaches customer traffic.
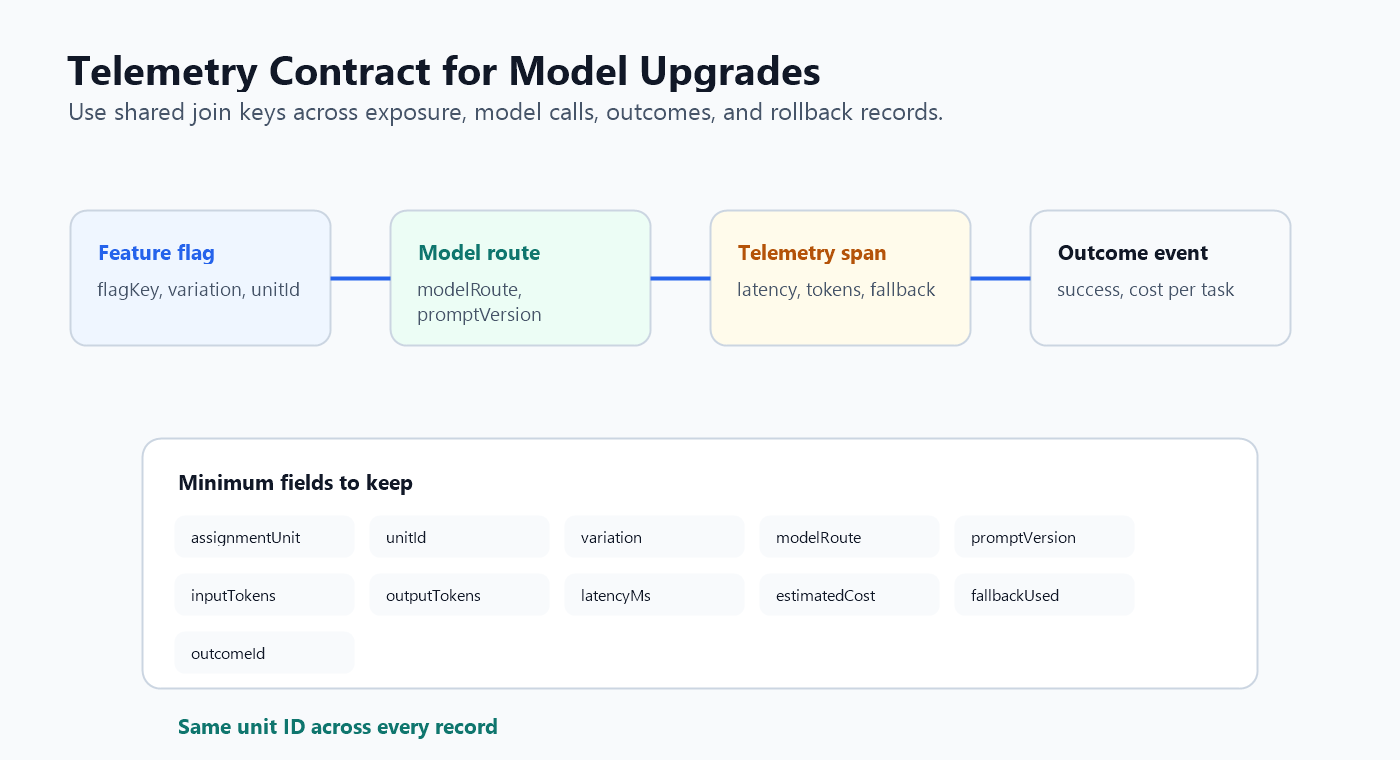
At minimum, record these fields:
| Field | Example | Purpose |
|---|---|---|
flagKey |
support_answer_model_route |
Names the release decision. |
variation |
candidate |
Separates control, candidate, and fallback. |
assignmentUnit |
conversation |
Defines the comparison unit. |
unitId |
conv_83921 |
Joins exposure, model call, outcome, and rollback evidence. |
modelRoute |
support_upgrade |
Records what actually ran, not only what was assigned. |
promptVersion |
support_v3 |
Prevents prompt drift from being mistaken for model cost. |
inputTokens |
1820 |
Supports cost and context-size analysis. |
outputTokens |
410 |
Supports cost and verbosity analysis. |
latencyMs |
2380 |
Supports p50, p95, p99, and SLA alerts. |
timeToFirstTokenMs |
620 |
Separates perceived responsiveness from full completion time. |
estimatedCostUsd |
0.018 |
Enables near-real-time guardrails before invoice reconciliation. |
fallbackUsed |
false |
Prevents failed candidate attempts from looking like clean control behavior. |
outcomeId |
case_2741 |
Joins cost to useful work, not only requests. |
OpenTelemetry's feature flag event convention is useful context for recording feature flag evaluation signals. The page currently marks the feature flag event convention as development status, so check language support before depending on a specific SDK implementation. The design point still holds: feature flag state belongs in telemetry because it changes runtime behavior and helps explain progressive releases.
In FeatBit, the Track Insights API can send feature flag variation results and custom metric events for analytics and experimentation. FeatBit also documents OpenTelemetry integration for exporting observability data from FeatBit backend services. Your application or model gateway should emit its own model-call telemetry so rollout evidence and runtime health can be connected.
Calculate cost before the invoice arrives
Provider invoices are necessary, but they are usually too late for rollout control. During a model upgrade, the release owner needs an estimated cost signal within minutes.
Use a request-level estimate:
estimated_cost =
  input_tokens * input_token_price
  + output_tokens * output_token_price
  + tool_call_cost
  + retrieval_cost
  + fallback_or_retry_cost
Then normalize it by useful work:
cost_per_successful_task =
  total_candidate_cost / successful_candidate_outcomes
The second number is often more important. A candidate model that costs more per request may still be acceptable if it dramatically improves successful outcomes. A candidate model that costs the same per request can still be worse if it requires more retries, longer outputs, or more human review.
For provider reconciliation, use the provider's official usage and cost data when available. OpenAI's API reference, for example, documents organization usage and cost result objects with fields such as input tokens, output tokens, request counts, cost amount, project, API key, user, model, and line item. Do not hard-code pricing assumptions into the article, runbook, or decision rule. Prices and billing units can change; the operational requirement is to reconcile near-real-time estimates against the provider's authoritative usage data.
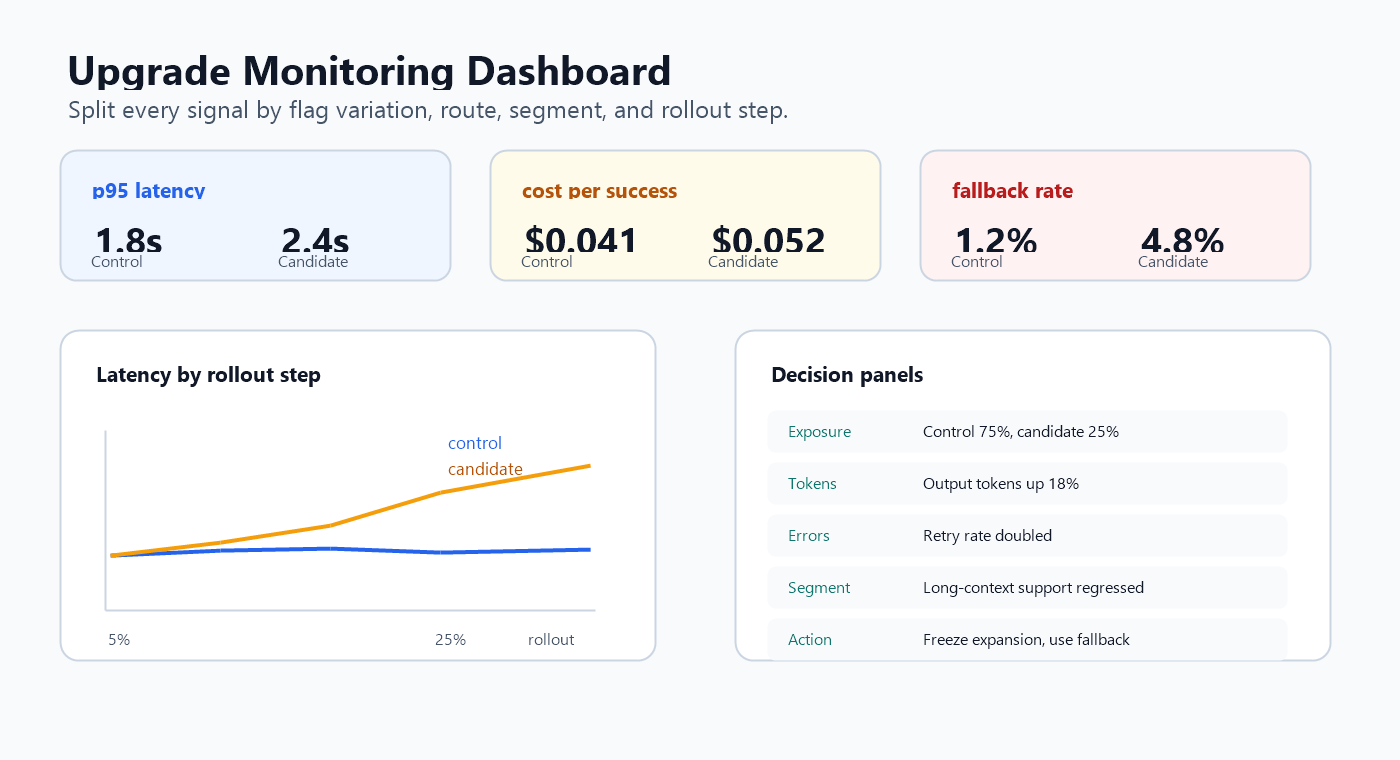
Build the dashboard around decisions, not curiosity
A model-upgrade dashboard should help an operator decide whether to continue, pause, or roll back. Avoid a dashboard that only shows total tokens and average latency. Aggregates hide the exact regressions that model upgrades create.
Use these panels:
| Panel | Split by | Decision it supports |
|---|---|---|
| p50, p95, p99 latency | variation, model route, segment, workflow | Is the candidate slower for users who matter? |
| Time to first token | variation and client surface | Does the UI feel slower even if total completion is acceptable? |
| Input and output tokens | variation, prompt version, workflow | Is cost rising because prompts, retrieval context, or outputs changed? |
| Estimated cost per request | variation and model route | Is the candidate burning budget too quickly? |
| Cost per successful outcome | variation and outcome type | Is extra spend buying a useful result? |
| Timeout, retry, fallback rate | variation and provider | Are hidden failures inflating latency and cost? |
| Segment heatmap | variation, locale, region, account tier, workflow | Is the regression scoped enough for targeted rollback? |
| Rollout state | flag percentage, targeting rule, last change | Can the operator connect the metric movement to exposure changes? |
The flag state matters because metric movement without exposure context is hard to act on. If p95 latency rises after the candidate expands from 5 percent to 25 percent, the release owner should see that expansion beside the graph.
For teams that need to analyze release evidence in a warehouse, the same join-key discipline applies. The companion guide on warehouse-native measurement for AI feature flags explains how to keep assignment, exposure, outcome, guardrail, and rollback evidence joinable outside the feature flag tool.
Alert on regression gates, not raw spikes
Raw spikes are noisy. A rollback alert should compare the candidate to a baseline, over a defined observation window, with enough traffic to avoid reacting to one odd request.
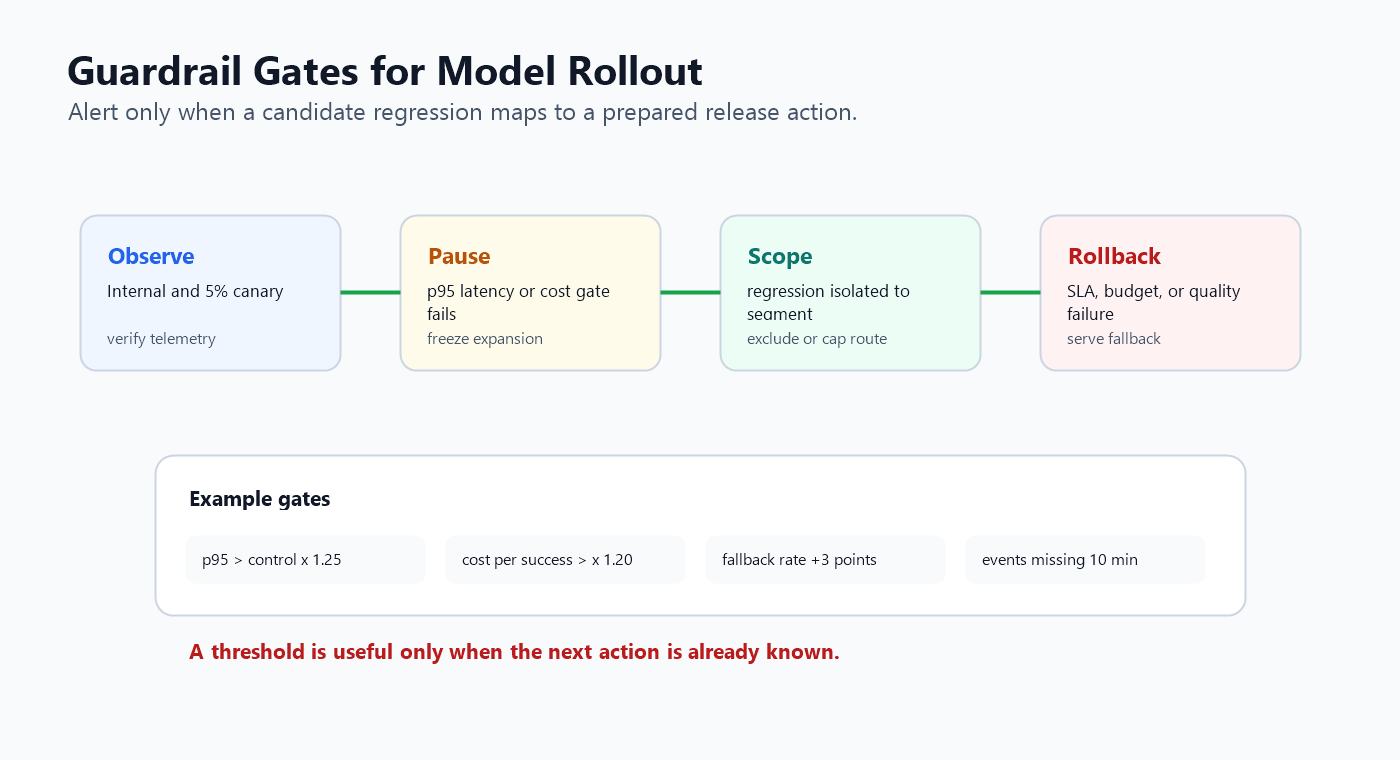
A practical guardrail spec might look like this:
model_upgrade_guardrails:
  scope:
    flagKey: support_answer_model_route
    candidateVariation: candidate
    controlVariation: control
    assignmentUnit: conversation
  observation_window: 30_minutes
  pause_expansion_when:
    - candidate_p95_latency_ms > control_p95_latency_ms * 1.25
    - candidate_cost_per_successful_task > control_cost_per_successful_task * 1.20
    - candidate_fallback_rate > control_fallback_rate + 0.03
    - candidate_outcome_events_missing_for > 10_minutes
  rollback_when:
    - candidate_p99_latency_breaches_user_sla
    - estimated_daily_candidate_cost_exceeds_budget_limit
    - provider_error_rate_causes_retries_to_double
    - severe_quality_or_safety_issue_confirmed
The numbers above are examples, not universal thresholds. A low-latency chat surface may need stricter limits. A back-office summarization job may tolerate slower responses if cost per successful task improves. The important practice is to define the gates before expansion, then connect each gate to an action.
FeatBit's measurement design guidance uses the same separation: the primary metric decides whether the release is useful, while guardrails detect harm. In a model upgrade, latency and cost guardrails should be visible before the experiment or rollout reaches broad traffic.
Separate slowdown causes from cost causes
Latency and cost often move together, but they do not always have the same cause. Triage them separately.
| Symptom | Likely causes | First action |
|---|---|---|
| Higher time to first token | provider queueing, larger model, cold start, region mismatch | narrow exposure and compare provider or region traces |
| Higher completion latency | longer outputs, higher max tokens, slower tool calls, retry loops | inspect output tokens, tool spans, retries, and fallback events |
| Higher input tokens | larger retrieval context, prompt growth, conversation history drift | compare prompt version, retrieval profile, and context size |
| Higher output tokens | changed system prompt, looser instruction, higher max output | cap output tokens or route a segment to fallback |
| Higher cost with flat latency | pricing tier, token mix, paid tool usage, image or search calls | split cost by line item, model route, and tool type |
| Higher latency with flat cost | dependency timeout, streaming delay, network path, rate limit backoff | inspect traces and provider error attributes |
This is why the telemetry contract should include prompt version, retrieval profile, token counts, fallback state, and tool usage. A single model=bigger_model field is not enough to explain what changed.
Roll back by scope when possible
If only one segment regresses, do not always roll back globally. A good control plane gives operators several actions:
- Freeze expansion for the candidate variation.
- Reduce candidate exposure from 25 percent to 5 percent.
- Exclude the affected account tier, region, locale, or workflow.
- Route only expensive long-context requests to fallback.
- Cap output tokens for the candidate route.
- Roll all traffic back to the previous stable model route.
The right action depends on the evidence. A global cost spike with no clear segment usually needs a broad rollback. A latency regression limited to one region may need scoped exclusion while the team investigates routing or provider behavior.
This is where feature flags are more useful than a static model configuration file. The release owner can change exposure rules without redeploying the application, and the audit trail can show who changed the route, when, and why.
Common mistakes
Only tracking total spend. Total spend rises when traffic rises. Compare cost per request and cost per successful outcome by flag variation.
Using average latency. Average latency hides tail pain. Track p95 and p99 for the candidate and control.
Recording assignment but not actual execution. If the candidate route times out and falls back, record the fallback. Otherwise the candidate may look healthier than it is.
Changing prompt, retrieval, and model without version fields. If multiple surfaces change, record the full route profile. Do not attribute all movement to the model.
Waiting for monthly billing data. Provider invoices are for reconciliation. Rollout guardrails need near-real-time estimates.
Alerting without a prepared action. Every latency or cost gate should name the action: pause expansion, reduce percentage, exclude a segment, or roll back.
FAQ
Should we monitor latency and cost during offline evaluation?
Yes, but offline evaluation is not enough. Offline tests can estimate speed and token usage for known prompts. Production monitoring catches traffic mix, provider behavior, retries, fallback, retrieval context, and user segments that the offline set may not represent.
Is this the same as A/B testing a model?
No. A/B testing decides whether the upgraded model improves a product outcome. Monitoring decides whether the candidate is slow, expensive, unreliable, or missing telemetry while the release is running. Most serious model upgrades need both.
What if the upgraded model is slower but better?
Treat that as a release decision, not an observability exception. Compare cost per successful outcome, user-facing latency budget, segment impact, and business value. If the benefit justifies the tradeoff, document the threshold and continue. If the slowdown breaks the experience, keep the control route or redesign the model profile.
A practical checklist
Before a model upgrade reaches broad traffic, confirm:
- The model route is controlled by a named feature flag with control, candidate, and fallback variations.
- The assignment unit is stable and appears in exposure, model-call, outcome, and rollback records.
- Telemetry records actual execution, including fallback and retry behavior.
- Latency dashboards show p50, p95, p99, and time to first token by variation.
- Cost dashboards show token usage, estimated cost, and cost per successful outcome by variation.
- Provider usage and cost data can reconcile near-real-time estimates.
- Guardrail thresholds are written before expansion.
- Each alert has a release action: freeze, reduce, exclude, cap, fallback, or rollback.
- Segment readouts are reviewed before increasing rollout percentage.
- The final decision includes cleanup or conversion of the temporary rollout flag.
The bottom line: a model upgrade gets safer when the team can answer the latency and cost question while exposure is still reversible. FeatBit controls who receives the candidate model route. Observability shows whether the route is slower or more expensive. Guardrails turn that evidence into a release decision before the upgrade becomes the default.
Source Notes
- FeatBit implementation context: AI control layer, safe AI deployment, measurement design, targeting rules, percentage rollouts, feature flag insights, Track Insights API, and OpenTelemetry integration.
- Observability context: OpenTelemetry's feature flag event semantic conventions are cited for the principle that feature flag evaluations should be observable because they affect runtime behavior.
- Provider cost context: OpenAI's usage and cost API reference is cited as an example of authoritative provider-side reconciliation for usage and cost aggregates. The article avoids current price claims because model prices and billing units change.
- Internal reader journey: continue with A/B testing AI models for business impact, A/B for models production architecture, and warehouse-native measurement for AI feature flags.
Image and Open Graph Notes
- Use
/images/blogs/monitor-model-upgrade-latency-cost/cover.pngas the Open Graph image because it summarizes the flagged model upgrade monitoring loop. - Use
latency-cost-dashboard.pngnear the opening because it shows the operator view for latency and cost guardrails. - Use
telemetry-contract.pngin the telemetry section because it makes the event fields and join path concrete. - Use
rollback-gates.pngin the alerting section because it connects metric thresholds to release actions.