
Did AI Coding Pay Off? A 90-Day Measurement Plan
Measure AI coding ROI across the whole delivery workflow: implementation, review, QA, rework, operations, tool spend, and the customer outcomes that follow. Faster authoring is an input to that evaluation. It is not the return on investment by itself.
A 90-day plan can help an engineering leader make a bounded decision about a tool or workflow. It cannot capture every long-term maintenance consequence or establish causality from an uncontrolled before-and-after comparison.
Use the copyable measurement template with your own data. The arithmetic example below is explicitly hypothetical and is checked in the accompanying TypeScript lab.
Decide what the evaluation is for
Start with a decision: continue a rollout, change a workflow, invest in verification capacity, restrict certain delegation, or investigate an expensive failure mode.
Define the population and work being compared. A platform migration, a routine UI change, and a new product feature should not be treated as equivalent units merely because they each produce a PR. Record staffing, work mix, architecture, seasonal demand, and simultaneous process changes.
The need to count downstream work is visible in a platform team's account of increased review and support load and a discussion of the costs of replacing SaaS. These are prompts for investigation, not independently verified cost benchmarks.
Build a small data dictionary
Choose a few measures the team can collect consistently. Separate active labor from elapsed waiting time; adding every hour a ticket sat in a queue to labor cost would inflate the estimate.
| Measure | Definition to preserve | Likely source | Decision it helps |
|---|---|---|---|
| Tool spend | Actual model, seat, review and related spend per period | Billing and usage records | Whether the workflow's recurring cost is justified |
| Authoring effort | Active implementation time for a comparable work category | Work samples and task records | Whether an apparent local saving exists |
| Review effort and wait | Active reviewing time and elapsed queue time, separately | Repository plus sampled work | Whether speed shifted into verification |
| QA and rework | Active verification and correction in non-overlapping categories | QA/CI and reopened work | Where completion becomes expensive |
| Delivery cycle | Defined start to production exposure; include deployment separately | Work tracking and CI/CD | Whether useful changes reach users sooner |
| Failure and recovery | Deployed-change denominator, incident linkage and severity | Incident and release records | Whether operational burden changed |
| Customer outcome | Defined result per eligible exposed user, tenant, or transaction | Product analytics or controlled experiment | Whether delivered behavior helped |
Do not convert an incidents-per-PR ratio into a probability that an individual PR caused an incident. Incident linkage can be incomplete, and one change can participate in several failures. Preserve the denominator and definition used in your own system.
A 90-day observation and decision schedule
| Window | Work | Artifact |
|---|---|---|
| Days 1–14 | Establish or reconstruct the baseline, comparable categories and measurement definitions | Baseline sheet, missing-data notes, owners |
| Days 15–45 | Observe the adopted workflow; inspect where effort and delay move | Weekly workflow view and selected change traces |
| Days 46–75 | Evaluate a named intervention, such as smaller PRs or a better release boundary | Intervention date, scope, comparison and execution evidence |
| Days 76–90 | Review outcomes, costs, uncertainties and continuing maintenance needs | Continue/change/limit decision and follow-up owner |
These are planning windows, not a statistical guarantee. If no credible historical baseline exists, record an observation-only period rather than inventing a pre-adoption comparison. A longer follow-up may be needed for low-volume or maintenance-heavy work.
Where practical, compare similar work or use a phased adoption design. Explain selection effects: engineers choosing AI for easy tasks, difficult tasks, or work they previously would not attempt can all distort a naive comparison.
Work through the total cost, not just the saved authoring time
Consider two hypothetical periods with the same assumed work mix and a loaded labor rate of $100/hour. These numbers are constructed to illustrate the accounting; they are not FeatBit customer results or an estimate of a typical team.
| Non-overlapping cost category | Baseline | AI workflow |
|---|---|---|
| Authoring hours | 400 | 280 |
| Review hours | 80 | 120 |
| QA hours | 80 | 100 |
| Rework hours | 40 | 60 |
| Incident work hours | 20 | 25 |
| Support hours | 20 | 25 |
| Total active hours | 640 | 610 |
| Labor at $100/hour | $64,000 | $61,000 |
| Additional tool spend | $0 | $4,000 |
| Modeled delivery cost | $64,000 | $65,000 |
Authoring saves 120 hours, but other work adds 90 hours. The modeled labor reduction is 30 hours, or $3,000. Adding $4,000 of tooling yields a $1,000 modeled cost increase for this hypothetical comparison.
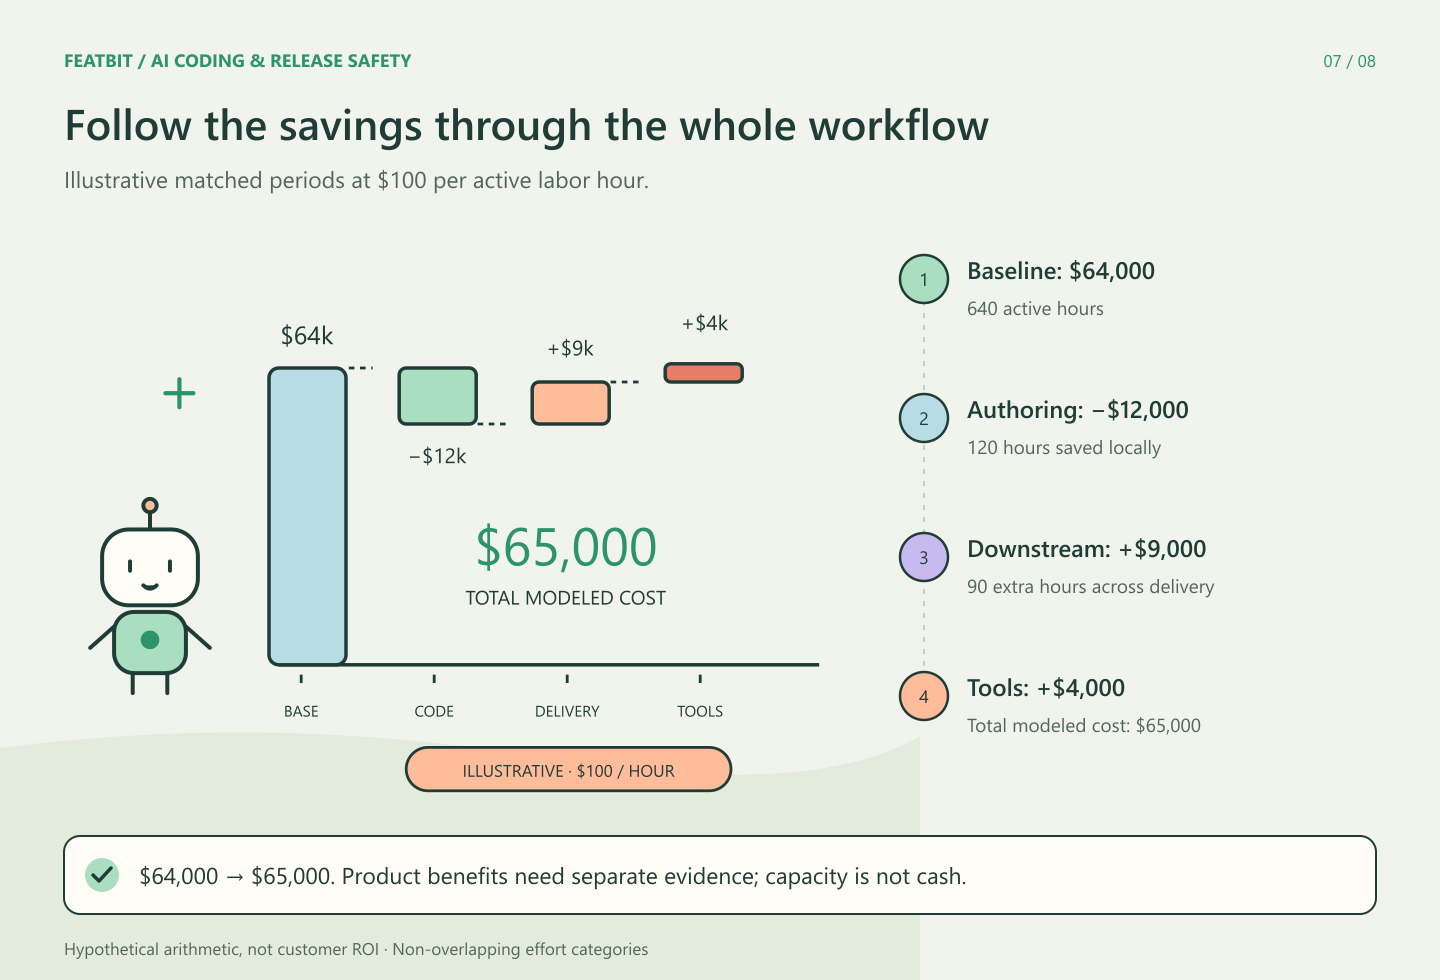
The lab's measurement code calculates these totals, and the verification record checks them. Change the assumptions to your own categories and rates rather than copying the result.
The example does not prove negative ROI. Faster useful delivery, reduced lead time, new capabilities, or higher-quality outcomes could change the business case. Their value needs independent evidence.
Keep capacity, cash and product value separate
An hour freed from authoring may become additional feature work, more careful verification, learning, or unused capacity. It is not automatically a cash saving. Salary expenditure usually changes only through an actual staffing or contractual decision.
Similarly, do not count the same incident engineer hours both in labor categories and again inside an estimated incident cost. Separate repair labor, third-party spend, evidenced revenue impact, service credits, and other consequences.
If a financial ROI calculation is appropriate, define the time horizon and which incremental costs and validated benefits belong in it. Keep gross gains and offsetting costs visible; do not label all value associated with an AI-built feature as value caused by AI. An experiment on that feature can estimate its effect under its design assumptions, not the counterfactual of whether humans could have built it.
Use release context to connect work with outcomes
FeatBit can contribute the feature, variation, audience and release context needed to connect delivered behavior with technical and product observations. Review hours, model bills, CI duration and incident labor still come from their respective tools. FeatBit is not presented here as a native all-in-one engineering ROI dashboard.
Use feature release management to define exposure and evidence. Where the question is whether a particular feature helps users, follow the business-impact experiment guide. That feature-level question is distinct from the organization-level economics in this article.
For a workflow intervention, smaller reviewable PRs or independent feature release provides a concrete change to evaluate. Record when the intervention begins; otherwise its effects become indistinguishable from changes in tools or work mix.
Make a decision the evidence can support
The 90-day review should produce a statement such as:
For this team and work category, authoring effort fell while review and QA rose.
The modeled net cost changed by X under the stated rates and exclusions.
Customer outcome evidence is sufficient / incomplete for the named releases.
We will continue / change / limit the workflow, with the following follow-up.
We cannot isolate AI's causal effect from the listed concurrent changes.
Use the broader AI coding delivery framework to locate the constraint, then measure whether a named response improves it. The useful result is an accountable operating decision, including a decision to keep observing when the evidence is incomplete.